Streamlit 101: Fast and Interactive Web Apps for Data Science

In today's data-driven world, having a powerful tool to build web applications for your data science and front-end projects is essential. Streamlit is an incredible framework designed to help you create fast and interactive web apps with minimal effort. Trust me, I would know, I recently built Civic Guru, an AI-powered Civic tool, in a weekend using the power of Streamlit😏
Throughout this article, we'll explore the core features of Streamlit, including its components, interactive widgets, and data visualization tools. You're about to uncover the secrets to creating efficient, visually appealing, and user-friendly web apps using Streamlit. Let's get started!
Installing Streamlit
Before you can dive into the world of Streamlit, you'll need to install the framework. Thankfully, this is a simple process. You can install Streamlit using pip, the Python package manager. Open your terminal or command prompt and enter the following command:
pip install streamlit
Once Streamlit is installed, you're ready to create your first Streamlit app. Start by creating a new Python file, such as my_app.py. To run your app, use the following command in your terminal:
streamlit run my_app.py
Now that you have Streamlit installed and know how to run an app, it's time to learn about the components that will make your app come to life.
Streamlit Components
Streamlit offers a variety of components that allow you to quickly build an engaging and interactive app. In this section, we'll introduce some basic components, such as headers, text, and Markdown formatting.
To add a header or subheader to your app, you can use the st.header() and st.subheader() functions. For general text, use the st.write() function. Here's a code snippet that demonstrates how to add headers and text to your Streamlit app:
import streamlit as st

st.title("Welcome to My Streamlit App!")
st.header("This is a header")
st.subheader("This is a subheader")
st.write("And this is some regular text.")

You can also include Markdown formatting in your app using the st.markdown() function. This allows you to create styled text with ease:
st.markdown("You can use **bold text** using Markdown!")
st.markdown("You can use *italic text* using Markdown!")
st.markdown("You can also add text with a [link](https://twitter.com/mikeyny_zw 'My twitter Account') using markdown")

Interactive Widgets
Streamlit offers a wide range of interactive widgets, such as buttons, checkboxes, and sliders, to make your app more engaging for users. In this section, we'll show you how to incorporate these widgets into your app.
To create a button, use the st.button() function:
if st.button("Click me!"):
    st.write("You clicked the button!")
For a checkbox, use the st.checkbox() function:
if st.checkbox("Check me!"):
    st.write("You checked the box!")
To add a slider, use the st.slider() function:
slider_value = st.slider("Pick a value", min_value=0, max_value=10)
st.write(f"You picked {slider_value}!")

By adding these interactive widgets to your Streamlit app, you'll provide users with an engaging and dynamic experience.
Handling User Input
Streamlit makes it easy to collect and process user input, allowing you to create more personalized and dynamic apps. In this section, we'll explore how to use text input and selection boxes.
To create a text input field, use the st.text_input() function:
user_text = st.text_input("Enter some text:")
if user_text:
    st.write(f"You entered: {user_text}")
For a selection box, use the st.selectbox() function:
options = ["Option 1", "Option 2", "Option 3"]
user_choice = st.selectbox("Choose an option:", options)
st.write(f"You chose: {user_choice}")

These components allow you to gather information from users and tailor your app's content based on their input.
Data Visualizations
Streamlit seamlessly integrates with popular data visualization libraries, such as Matplotlib, Seaborn, and Plotly. In this section, we'll demonstrate how to display data and create visualizations in your app.
To display a data table, you can use the st.dataframe() function:
import pandas as pd

data = pd.DataFrame({"Column 1": [1, 2, 3], "Column 2": [4, 5, 6]})
st.dataframe(data)

For data visualizations, you can use your preferred library and display the resulting plot using the st.pyplot() function for Matplotlib and Seaborn, or the st.plotly_chart() function for Plotly:
import streamlit as st
import numpy as np
import matplotlib.pyplot as plt
import seaborn as sns
import plotly.express as px

# Matplotlib example
st.header("Matplotlib example")
x = np.linspace(0, 10, 100)
y = np.sin(x)
fig, ax = plt.subplots()
ax.plot(x, y)
st.pyplot(fig)

# Seaborn example
st.header("Seaborn example")
iris = sns.load_dataset("iris")
fig = sns.pairplot(iris, hue="species")
st.pyplot(fig)

# Plotly example
st.header("Plotly example")
fig = px.scatter(iris, x="sepal_width", y="sepal_length", color="species")
st.plotly_chart(fig)


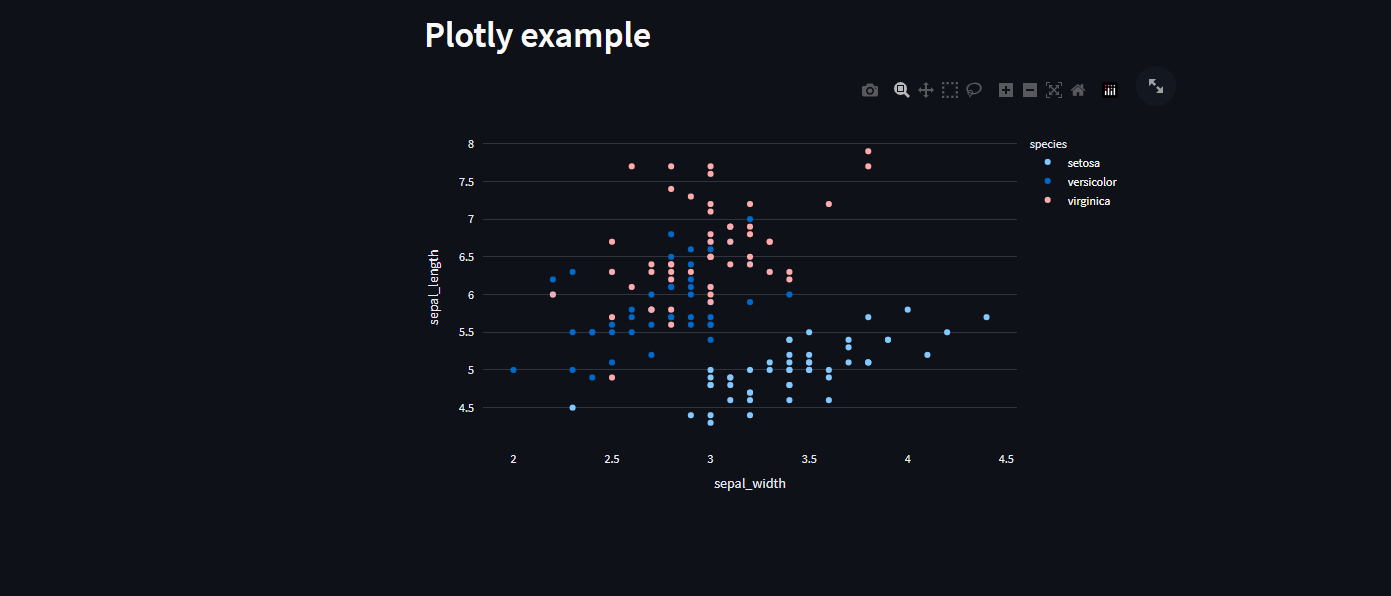
By incorporating data visualizations into your Streamlit app, you can create more informative and visually appealing content for your users.
Interactivity and Caching
To make your app more efficient and responsive, you can use Streamlit's caching feature. Caching allows you to store the results of time-consuming calculations, data fetches, or CPU-heavy resources (e.g., database connections), so they don't have to be recalculated every time a user interacts with your app.
To implement caching, use the @st.cache decorator before the function you'd like to cache:
import time

@st.cache
def slow_calculation():
    time.sleep(5)  # Simulate a slow calculation
    return 42

if st.button("Run slow calculation"):
    result = slow_calculation()
    st.write(f"The result is {result}.")
With caching, the slow calculation only runs once, even when the user clicks the button multiple times. The second time the user is given the cache value meaning faster performance and more efficient use of resources.
Deploying Streamlit Apps
Once you've built your Streamlit app, you'll want to share it with the world. You can deploy your app using various platforms, such as Streamlit Sharing, Heroku, or even your own server using cloud providers like Digital Ocean. Each platform has its specific requirements and setup process, so be sure to consult the respective documentation for guidance.
Before deploying your app, it's essential to ensure that it runs smoothly and without errors. Additionally, consider fine-tuning the appearance and interactivity of your app to create a polished and engaging user experience.
Conclusion
Congratulations on completing Streamlit 101! You've now uncovered the secrets to creating efficient, visually appealing, and user-friendly web apps using Streamlit. We've explored the core features of Streamlit, including its components, interactive widgets, data visualization tools, caching, and deployment options.
With this newfound knowledge, you're well-equipped to harness the full potential of Streamlit in your data science and front-end projects. So, go forth and create amazing web applications that not only showcase your data but also provide an engaging and interactive experience for your users. Remember, the possibilities are endless with Streamlit, so don't be afraid to experiment and push the boundaries of what you can achieve.
Happy coding, and here's to building fantastic web apps with Streamlit!